Nine economic charts of the week you really must see

By
We may earn a commission from links on this page.

Japan’s trade deficit remained bad

Image for article titled Nine economic charts of the week you really must see

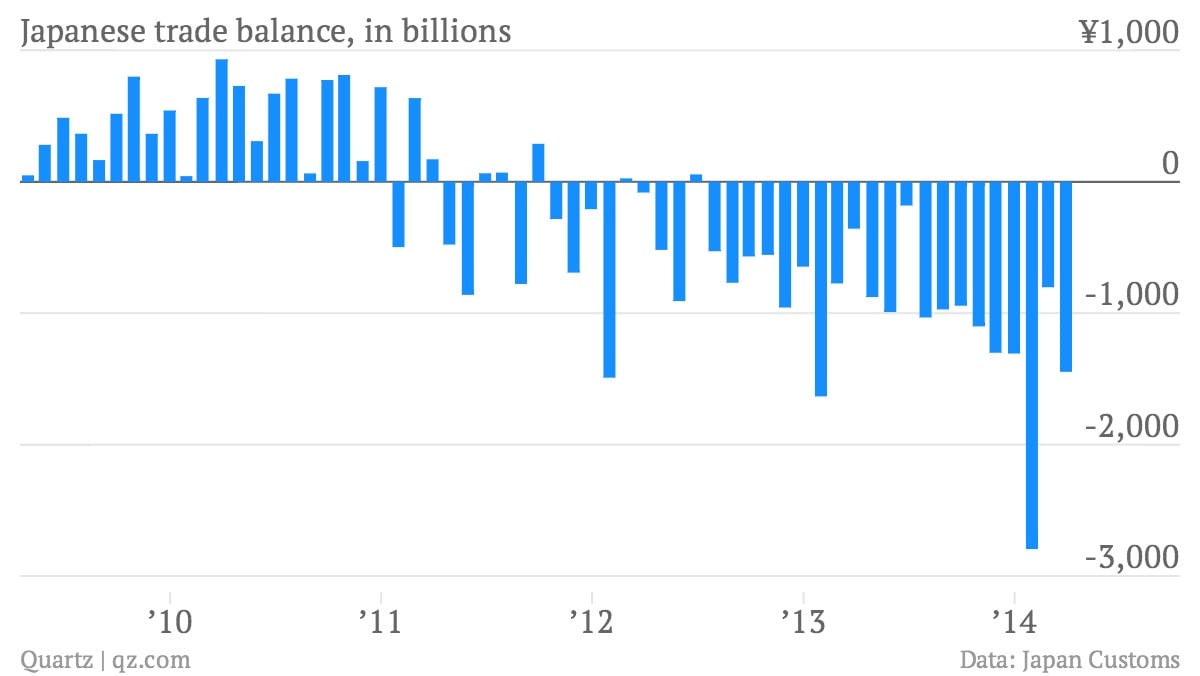
In March, a surge of imports (ahead of an April tax increase) combined with the weakest export growth in a year.

US existing home sales stayed soft…

Image for article titled Nine economic charts of the week you really must see

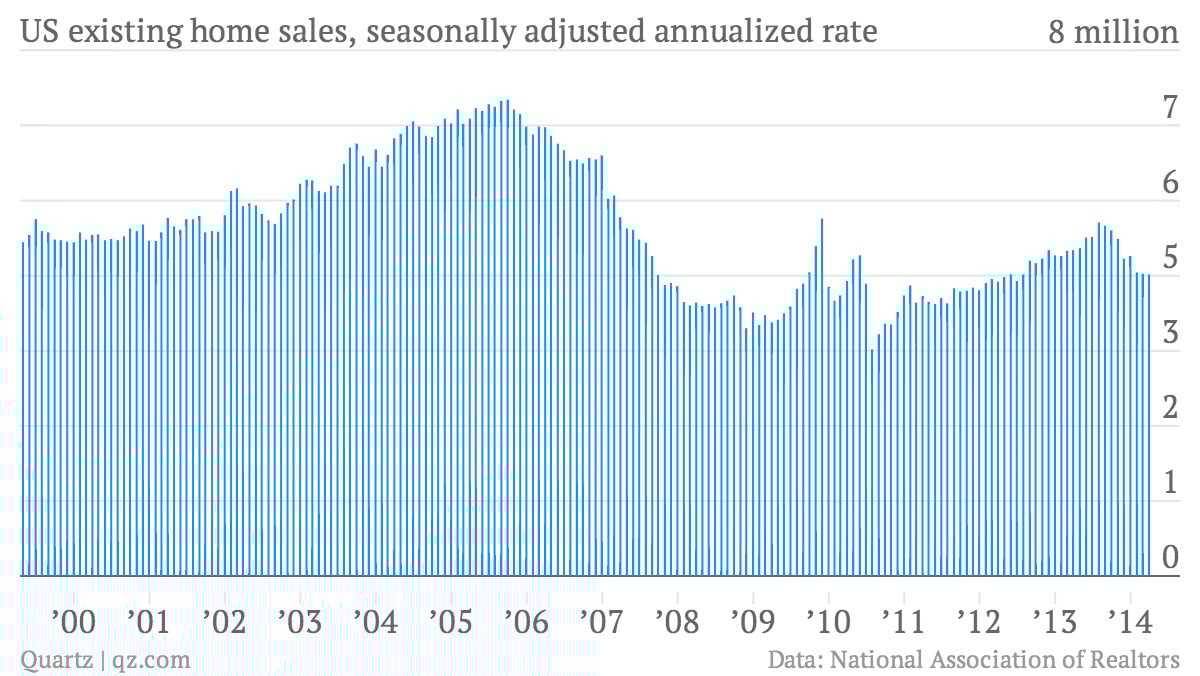
Sales declined for the third consecutive month, although it’s unclear if the spring weather will bring a rebound.

…and new home sales dropped sharply

Image for article titled Nine economic charts of the week you really must see

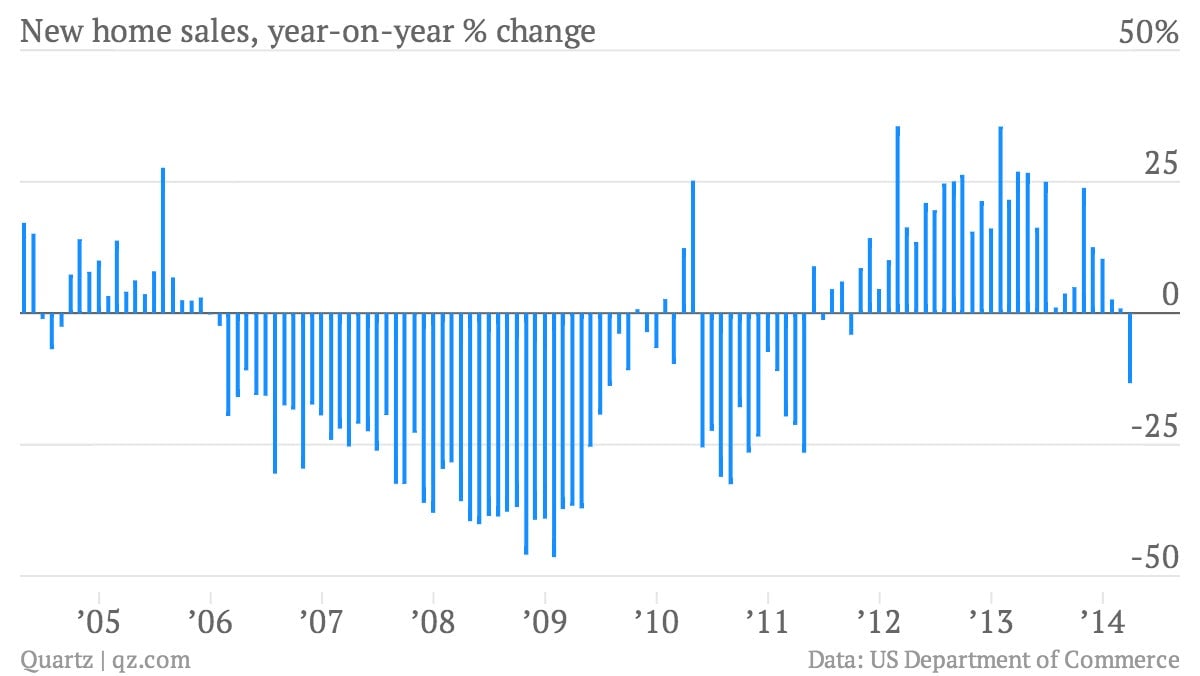
Some think the problem could be lack of supply.

China’s manufacturing sector contracted

Image for article titled Nine economic charts of the week you really must see

That’s one of the reasons Chinese stocks have been doing so poorly.

 South Korea posted solid first-quarter GDP growth

Image for article titled Nine economic charts of the week you really must see

Housing construction and exports led the way.

US durable goods orders rebounded

Image for article titled Nine economic charts of the week you really must see

The core reading—nondefense capital goods orders, excluding aircraft—also suggested strength in business spending.

April inflation in Tokyo surged

Image for article titled Nine economic charts of the week you really must see

Thanks to the new VAT tax, April prices in Tokyo rose by their fastest pace since 1992.

Brazil’s current account balance narrowed a bit

Image for article titled Nine economic charts of the week you really must see

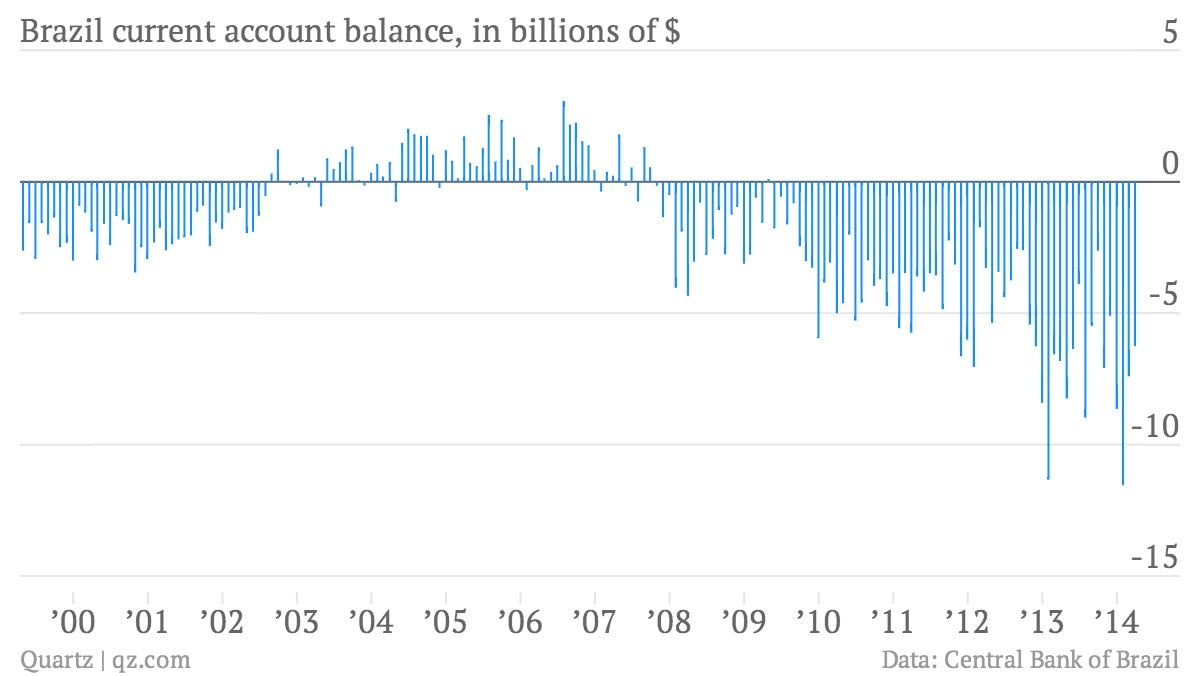
But it still shows Brazil is very dependent on foreign lending.

The mood of American consumers improved

Image for article titled Nine economic charts of the week you really must see

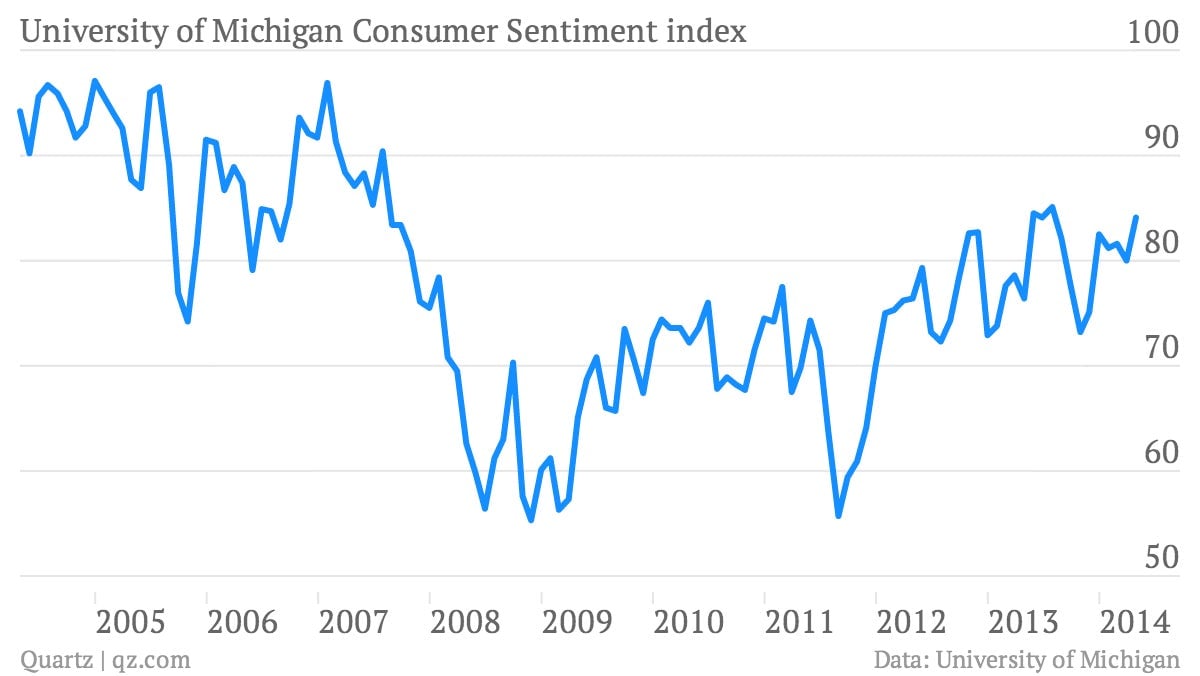
The University of Michigan gauge of consumer sentiment is flirting with post-crisis highs.