Search
Newsletters
Editions
Home
Latest
Business News
Money & Markets
Tech & Innovation
A.I.
Lifestyle
Leadership
✉️ Emails
🎧 Podcasts
The 10 most important charts of the week
Markets
The 10 most important charts of the week
By
Matt Phillips
and
Matt Phillips
Share to X
Share to Facebook
Share to Reddit
Share to Email
Share to Link
Add Quartz on Google
Share to X
Share to Facebook
Share to Reddit
Share to Email
Share to Link
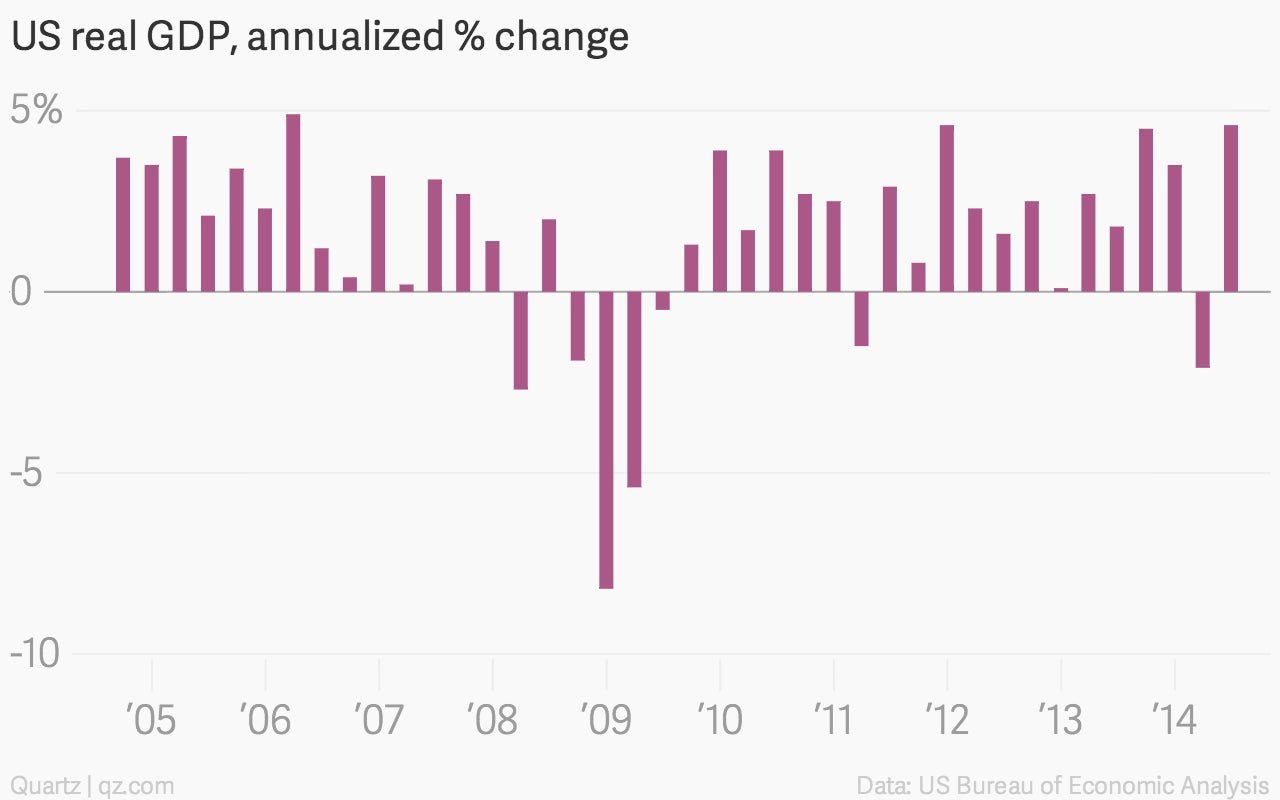
US GDP was a peppier than previously thought, rising at a
4.6% annualized rate in the second quarter
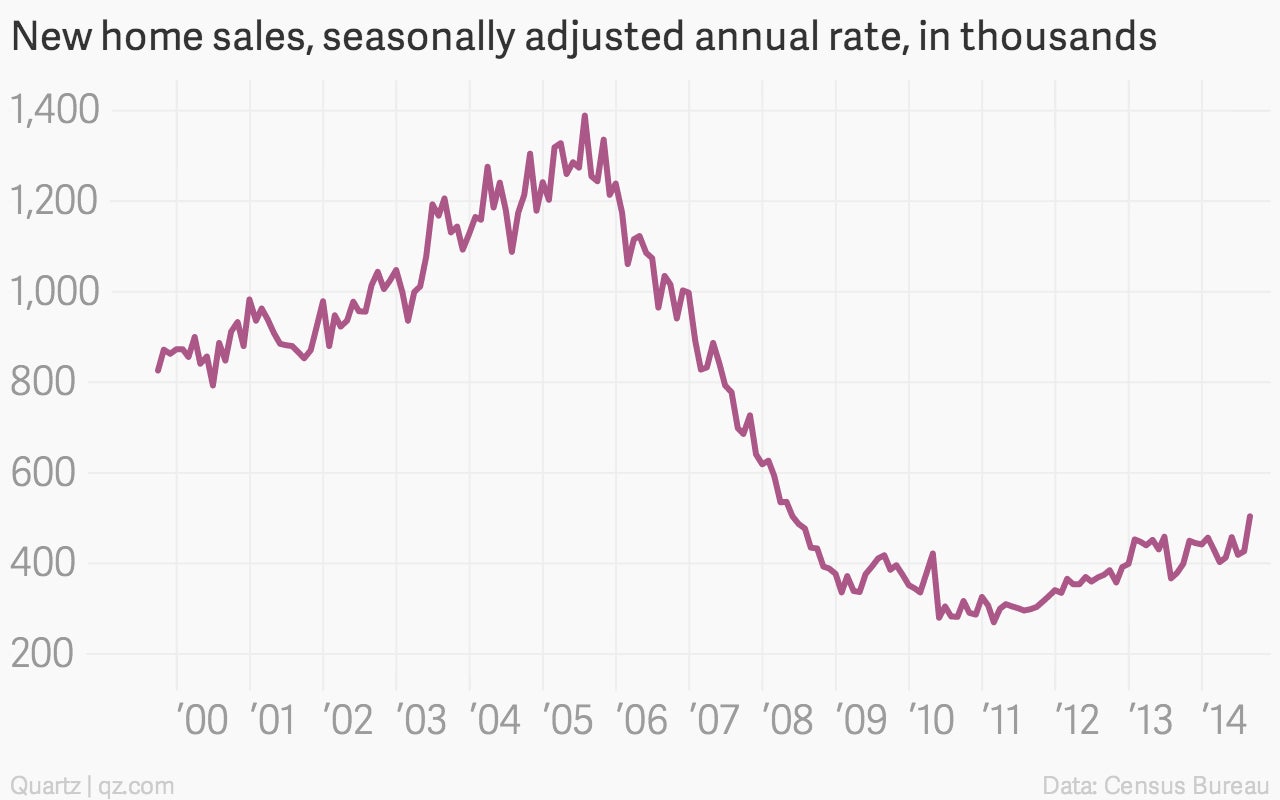
US new home sales surged 18% in August, hitting a six-year high
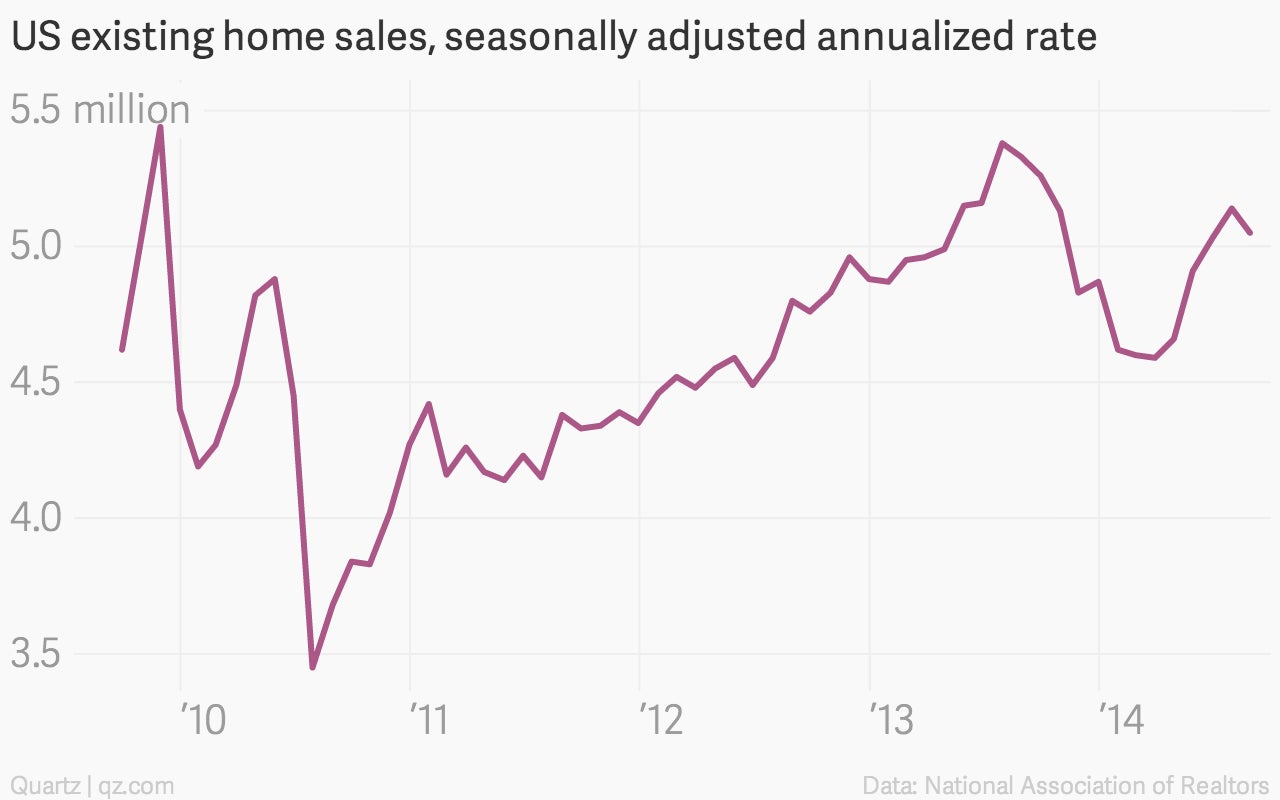
The much-larger market for existing homes
fell 1.8% in August
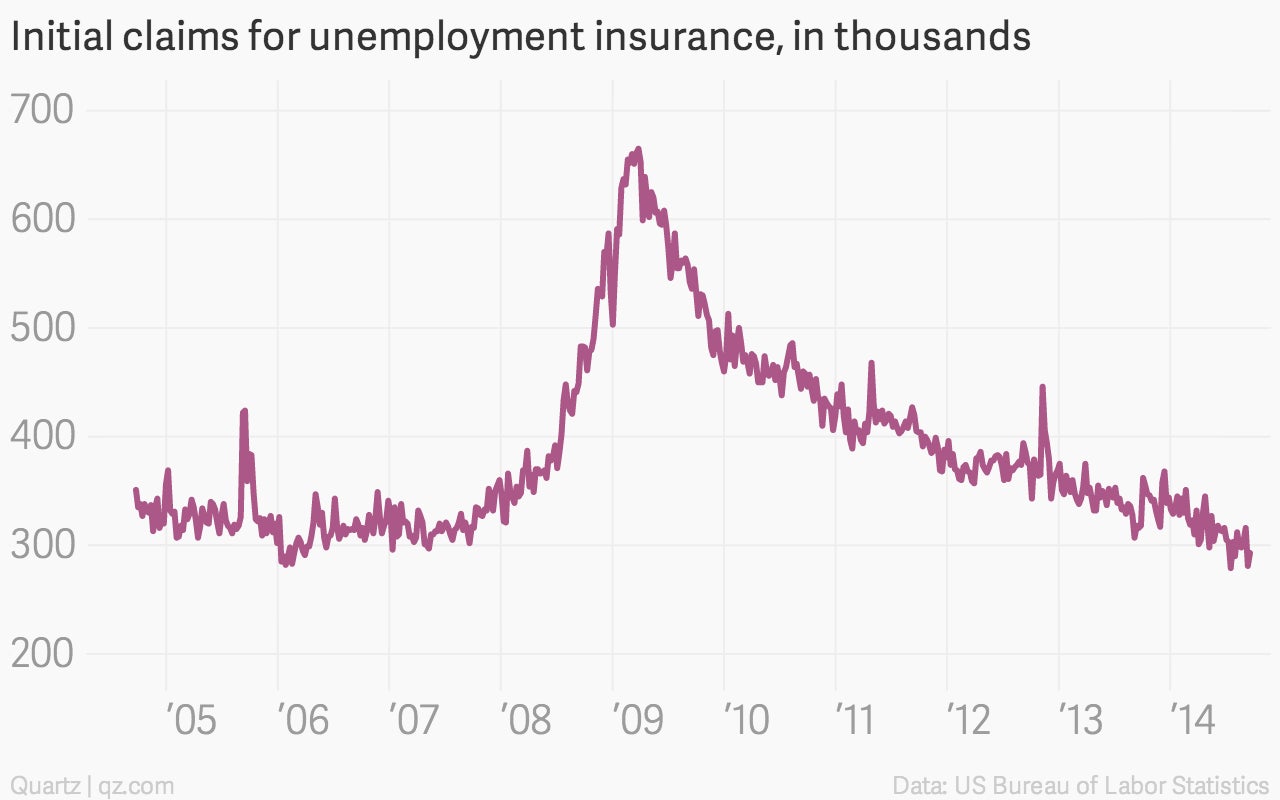
And weekly jobless claims continued to signal a strengthening
of the labor markets
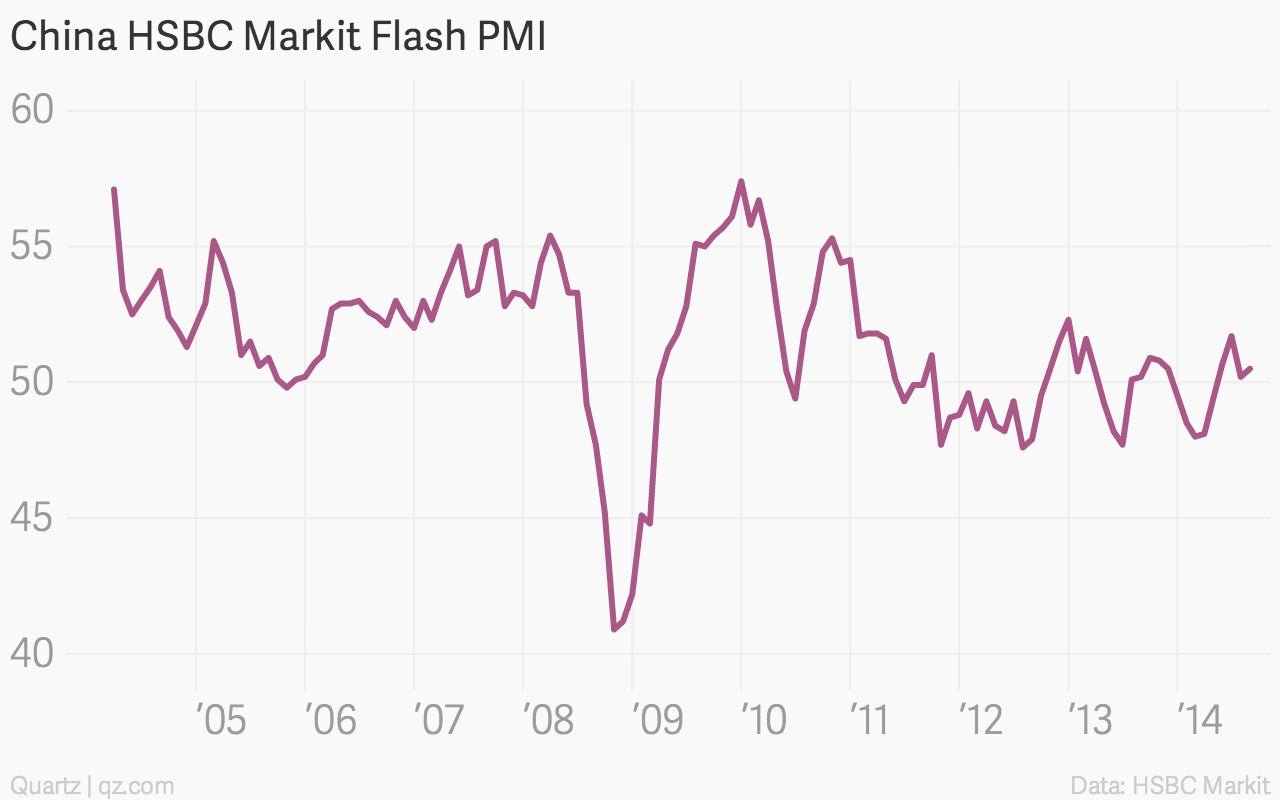
China’s manufacturing economy continued to expand in September,
which was better than expected
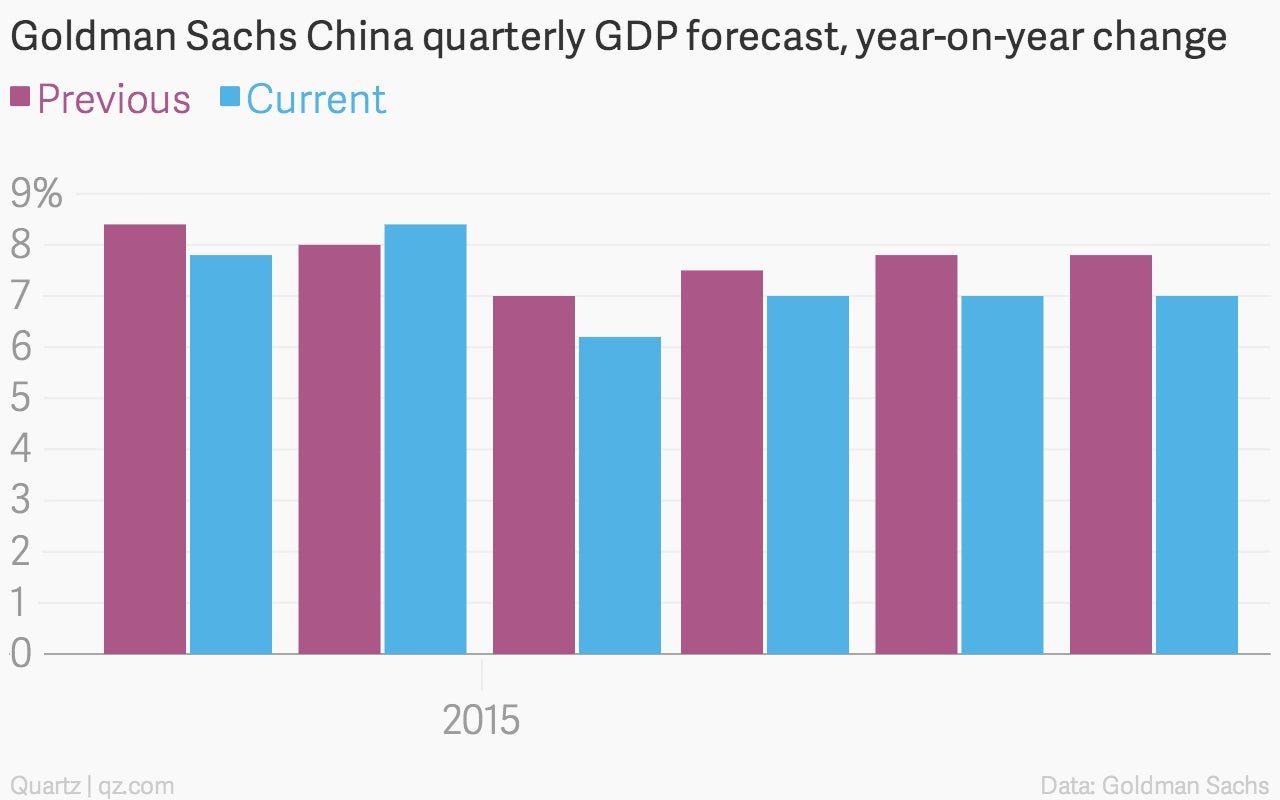
But Goldman Sachs slashed its
economic forecast for the country
Brazil’s unemployment rate ticked up to 5%,
but remains quite low
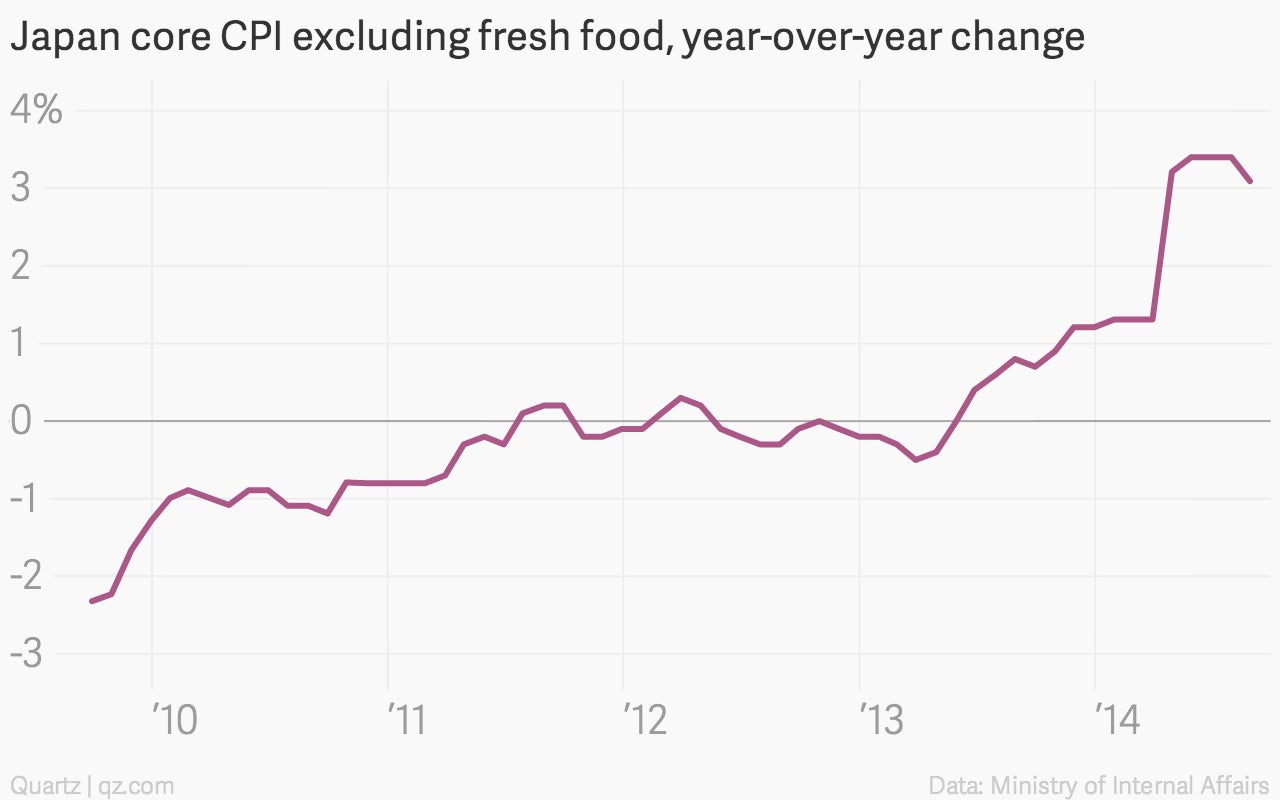
Japan continued to have trouble generating inflation,
an ongoing struggle for Abenomics
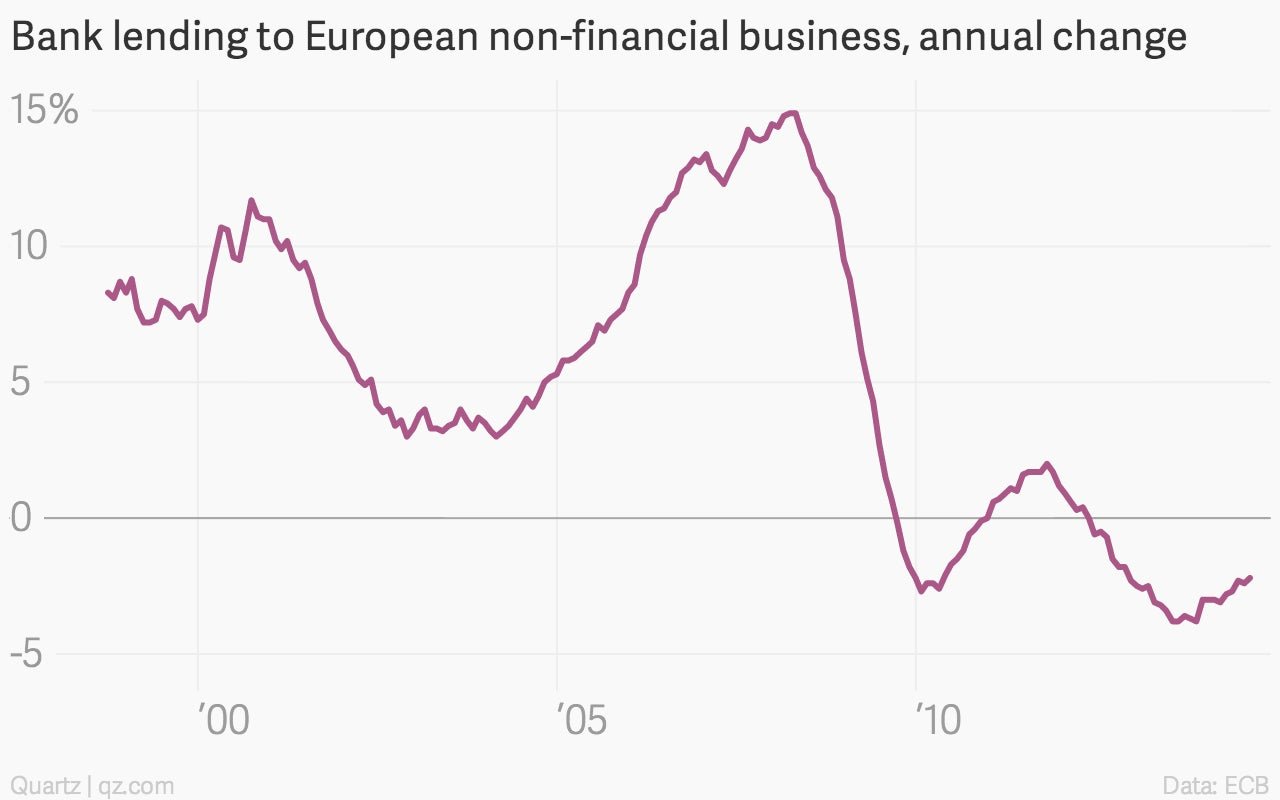
European business lending
continued to contract
(pdf)
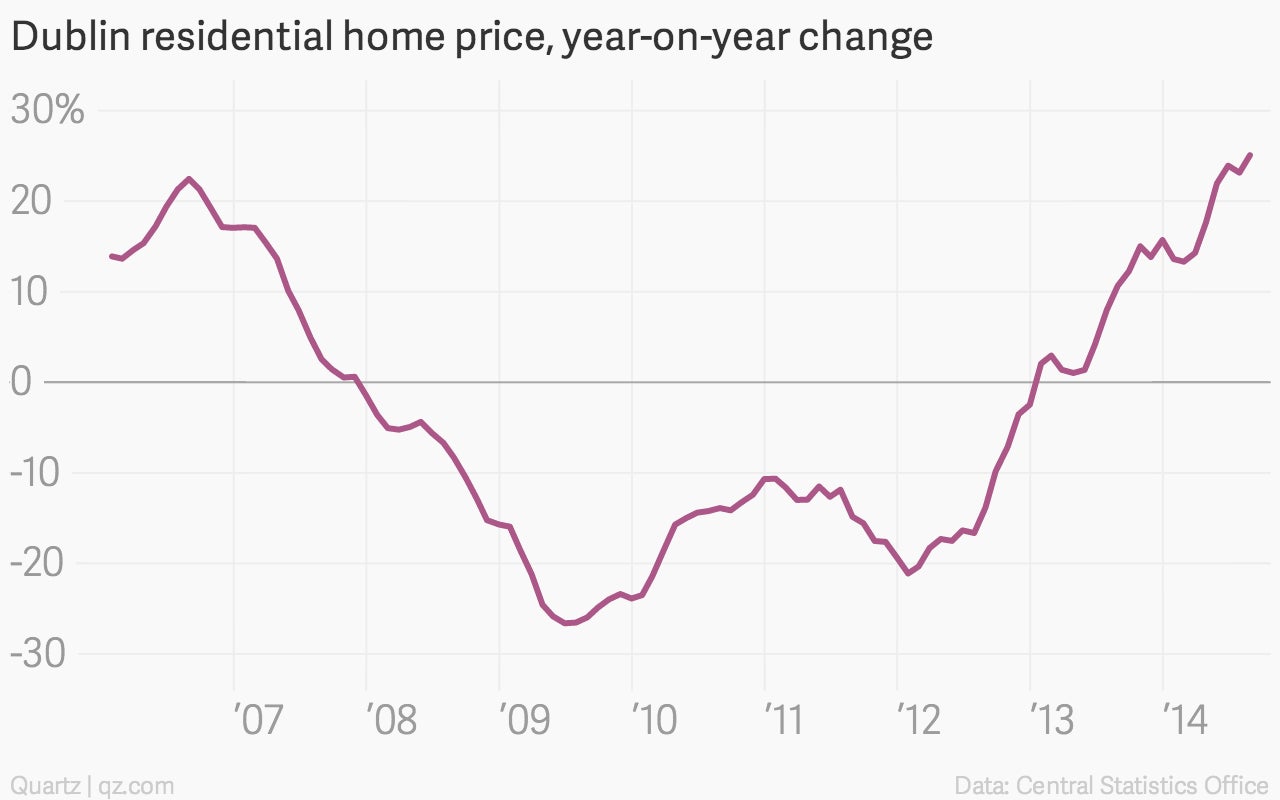
Irish property prices continued to rebound,
led by a surge in Dublin
📬 Sign up for the Daily Brief
Our free, fast and fun briefing on the global economy, delivered every weekday morning.
Sign me up