It’s no surprise that Donald Trump is attacking climate-change science. What’s surprising is the pace at which he is doing it. It hasn’t even been a week since he became the US president, and his administration has already announced a series of executive orders that could cause serious harm to the environment and undermine the work of hundreds of scientists.
Just as Trump is denying global warming exists with attacks on the Environmental Protection Agency (EPA) and the National Park Servies (NPS), NASA has released a series of stunning images that capture just how much climate change is affecting the globe. Of course, the timing may just be a coincidence. We’ve curated some of the best.
Drying Lake Poopó, Bolivia
Lake Poopó, Bolivia’s second largest lake and an important fishing resource for local communities, has dried up once again because of drought and diversion of water sources for mining and agriculture. The last time it dried was in 1994, after which it took several years for water to return and even longer for ecosystems to recover. In wet times, the lake has spanned an area approaching 1,200 square miles (3,000 square kilometers). Its shallow depth—typically no more than 9 feet (3 meters)—makes it particularly vulnerable to fluctuations.
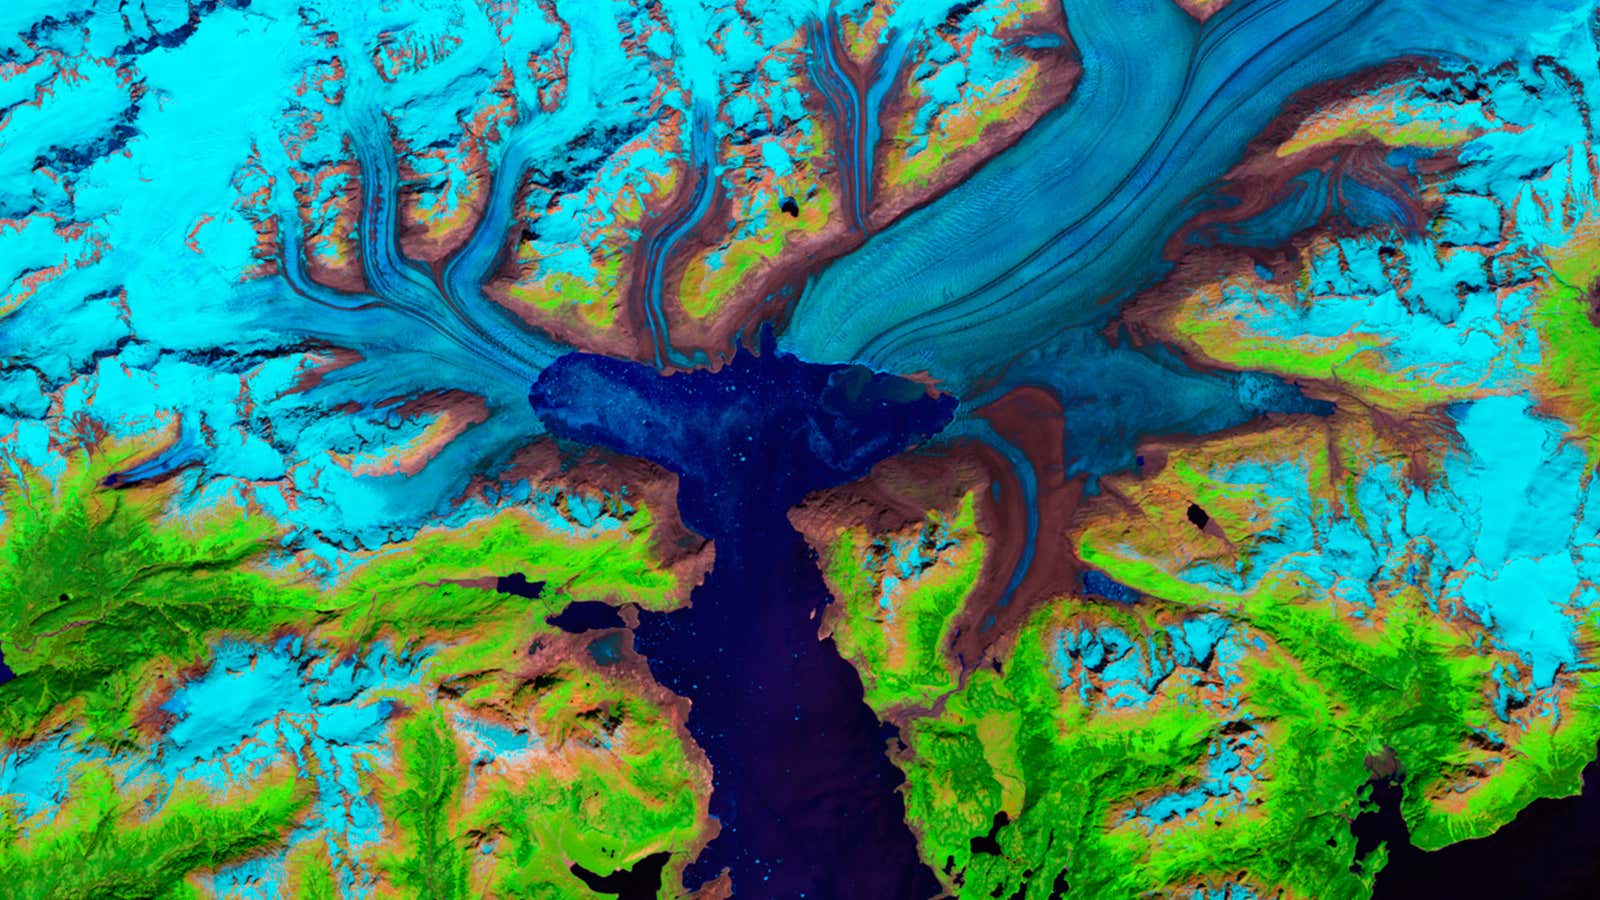
Columbia Glacier melt, Alaska
Alaska’s Columbia Glacier descends through the Chugach Mountains into Prince William Sound. When British explorers surveyed the glacier in 1794, its nose extended to the northern edge of Heather Island, near the mouth of Columbia Bay. The glacier held that position until 1980, when it began a rapid retreat. The glacier has thinned so much that the up and down motion of the tides affects its flow as much as 7.5 miles (12 kilometers) upstream, until the glacier bed rises above sea level and the ice loses contact with the ocean.
Pine Island Glacier calving, Antarctica
Pine Island is one of the largest and fastest moving glaciers in Antarctica. The Pine Island Glacier Basin contributes more ice to the sea than any other ice-drainage basin in the world. This has increased due to recent acceleration of the ice stream caused by thinning of the glacier. Scientists are concerned about the impact Pine Island’s continued thinning will have on sea level. The 2011 image shows a series of splits along the western edge of the glacier. The same area in 2012 reveals a major break that will eventually extend all the way across the glacier and calve a giant iceberg expected to cover about 350 square miles (900 square kilometers).
Pedersen Glacier melt, Alaska
The foreground water in the earlier image is part of a lagoon, adjacent to Aialik Bay, into which Pedersen Glacier was calving icebergs. In the 2005 photograph, most of the lagoon has filled with sediment and supports grasses, shrubs and aquatic plants. The dead trees visible among the grasses are remnants of a forest that was drowned when the coast sank by some 10 feet (3 meters) during the 1964 Alaskan Earthquake. Pedersen Glacier’s terminus has retreated more than a mile (2 kilometers) and stands of trees have grown between the wetland and the glacier. The tributary high above Pedersen Glacier separated from it sometime during the third quarter of the 20th century.
Rising water, Caspian Sea
The Caspian Sea is the world’s largest landlocked body of water, and it’s getting bigger. In the past couple of decades, heavy rains in the greater Volga Basin have greatly increased the incoming flow from the Volga River, the Caspian’s primary source of water. These images show a small portion of the shoreline. In the 2011 image, coastal settlements have been flooded, displacing inhabitants and shutting down industrial facilities. The groundwater level has also risen, leading to swamping and increasing the salinity of lowland territories. Tyuleniy Island (the prominent island) has visibly lost land mass, with the rising water contributing to the decline of the island and the marshes around it that support fowl and other animals.
Drought in Lake Powell, Arizona and Utah
Prolonged drought coupled with water withdrawals have caused a dramatic drop in Lake Powell’s water level. These images show the northern part of the lake, which is actually a deep, narrow, meandering reservoir that extends from Arizona upstream into southern Utah. The 1999 image shows water levels near full capacity. By May 2014, the lake had dropped to 42 percent of capacity.
You can see the rest of the series on NASA’s Images of Change site, where they introduce it as:
Our Images of Change gallery features images of different locations on planet Earth, showing change over time periods ranging from centuries to days. Some of these effects are related to climate change, some are not. Some document the effects of urbanization, or the ravage of natural hazards such as fires and floods. All show our planet in a state of flux.
