
I love charts. So much so, that I have made a career out of making and appreciating data visualization. But, after all these years, I think I’ve finally discovered the chart that is my very favorite.
In 2016, the World Health Organization estimates that over 150 million children under the age of five were too short for their age as a result of malnutrition. This underdevelopment, referred to as stunting, has large impacts on a child’s long-term cognitive and physical development. Most of the world’s stunted children are in Africa and South Asia.
The economist Guenther Fink, a professor at the Swiss Tropical and Public Health Institute, says that parents of stunted children are often unaware of the problem. Fink has found that there is little relationship between a parent’s perception of whether their child was stunted, and whether the child is actually too short for their age.
Believing this lack of awareness might be a problem, Fink and several other researchers associated development policy lab Innovations for Poverty Action conducted an experiment testing whether increased knowledge of stunting might improve child health. The year long experiment was conducted in rural Zambia and included over 500 children between 6 months to 24 months of age. The researchers tested two different ways of increasing awareness with different sets of families.
1️⃣ Every three months, they offered community meetings at which children’s heights and weights were measured, and parents were given information about how to best feed their kids.
2️⃣ The following growth chart was installed on a wall of their homes, so parents could easily check their child’s height relative to a healthy child. The chart contains the same nutrition information shared at those community meetings. The growth chart was an original idea of the researchers.
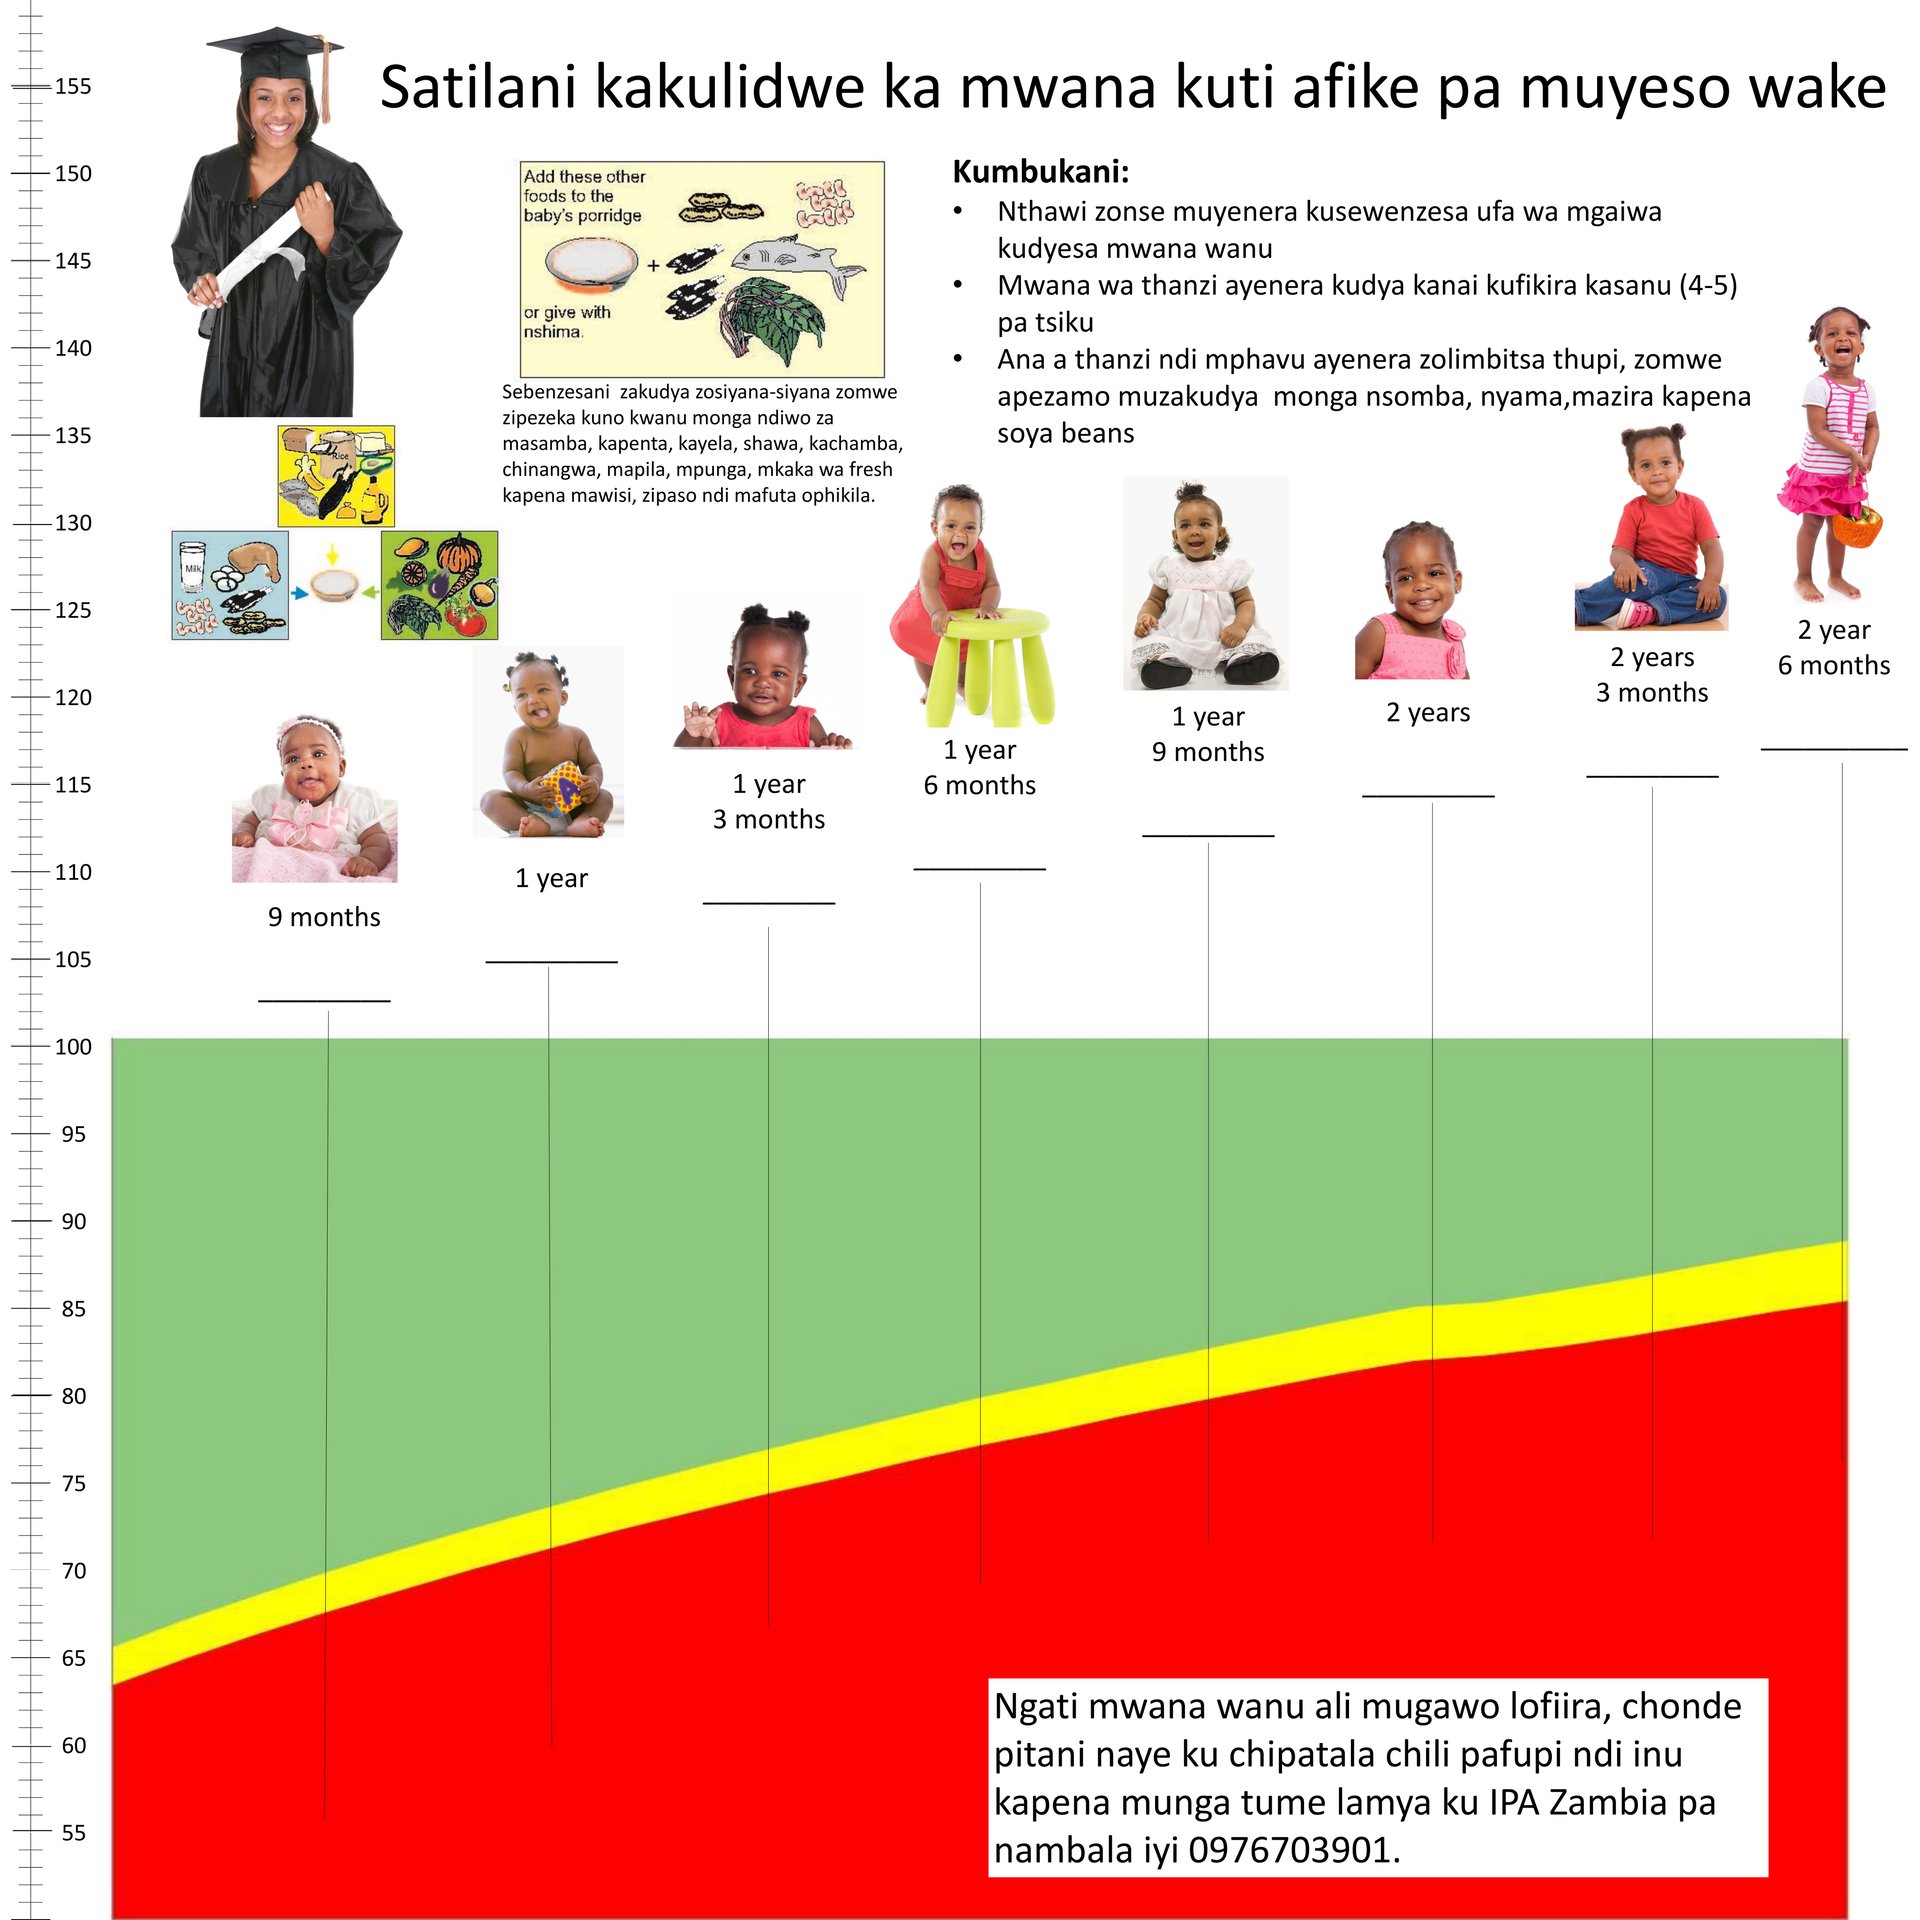
Stunting remained high in both groups, but though the community meetings were well attended, they were not nearly as effective in reducing stunting as the chart. One year after the experiment began, 87% of the children in the community meetings group were stunted, compared to just 72% of children in households that received the chart. 92% of the children in a comparison group that received no program were stunted.
The success of the chart compared to the community meeting means that knowledge of stunting isn’t quite enough to change behavior. Rather, Fink thinks the chart may have been effective because it offered a more consistent reminder, and because the images in the chart offered inspiration.
Though the difference was statistically significant, the study was a relatively small one. The researchers hope to get the funding for a large scale experiment that would ensure the chart is effective, and to develop a better understanding of why it works. Assuming they are able to confirm their results, they might have just made the coolest chart the world has ever seen.