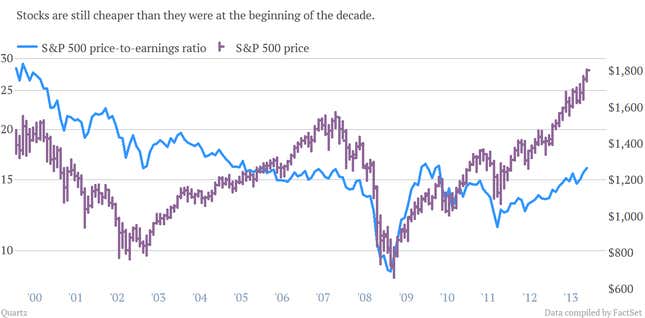
The best measure of the US stock market, the Standard & Poors 500 index, has been shooting up to record highs in the past several weeks. Given the searing memory of the 2008 crash, it’s almost impossible not to ask if this is a bubble. Indeed, with interest in IPOs renewing, tech entrepreneurs rejecting $3 billion buy-out offers, and the great rotation from bonds into stocks continuing, this may seem unsustainable, and some bearish analysts are warning of a correction to come.
But look up at that chart. The S&P 500 may be at a record high, but the ratio of a stock’s price to its last twelve months of earnings—a.k.a. the trailing P/E ratio—is still lower than it has been since the mid-2000s, let alone during the dotcom bubble. So by this measure, stocks are still fairly cheap (though not as cheap as they were if you smartly bought at the bottom of the market).
The average trailing P/E ratio in the 10 stock-market peaks of the past 57 years has been 18.7. Today’s is 16.1. At the last peak, in 2007, it was 15.96—but that crash didn’t start in the stock market. At the market peak before that, when the dotcom boom ended in 2000, the ratio went as high as 29.16. So while a correction could be coming, it seems too soon to say that this stock market is overvalued.